As designers, we often have to prove to ourselves and the stakeholders that the task flow we just created is worthy of implementation. It’s difficult to find convincing arguments to make them believe that the upgraded flow will be successful (RIP Great ideas).
What is one of the best ways to show the efficiency of a product or functionality? Numbers! To be more specific — ideas are validated with data. I found a simple method for such scenarios and share it with you in this article.
Take a look at the example of the onboarding flow:
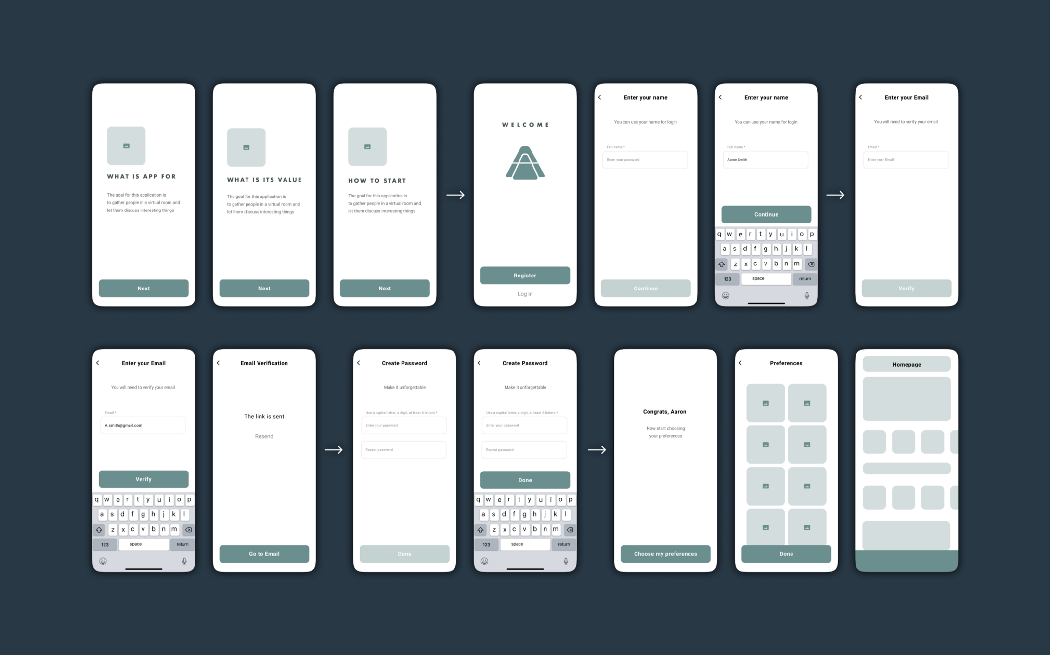
Onboarding flow
As soon as we have a flow, all the actions that a user will have to take should be written down (Note that these actions can vary depending on the type of flow; there might be gestures, fingerprints, and screens that disappear within a few seconds). In this example, there are four actions provided:
- Tap
- Type
- Open external link
- Scroll
Next, we need to evaluate them according to their importance (mental workload), time, and effort spent. For example, Scroll seems to be the easiest task as a user doesn’t have to make a crucial decision — they merely look through the content fast while scrolling. Therefore I assigned it 1 point. It is a very subjective part of the process, so feel free to experiment while evaluating. In my case Tap is 3 points, Type is 5 points, and External link is 10 points (this is the highest because users have to leave the app, which can be dangerous).
Assess the screens
Place signs to identify each action near the corresponding screens:
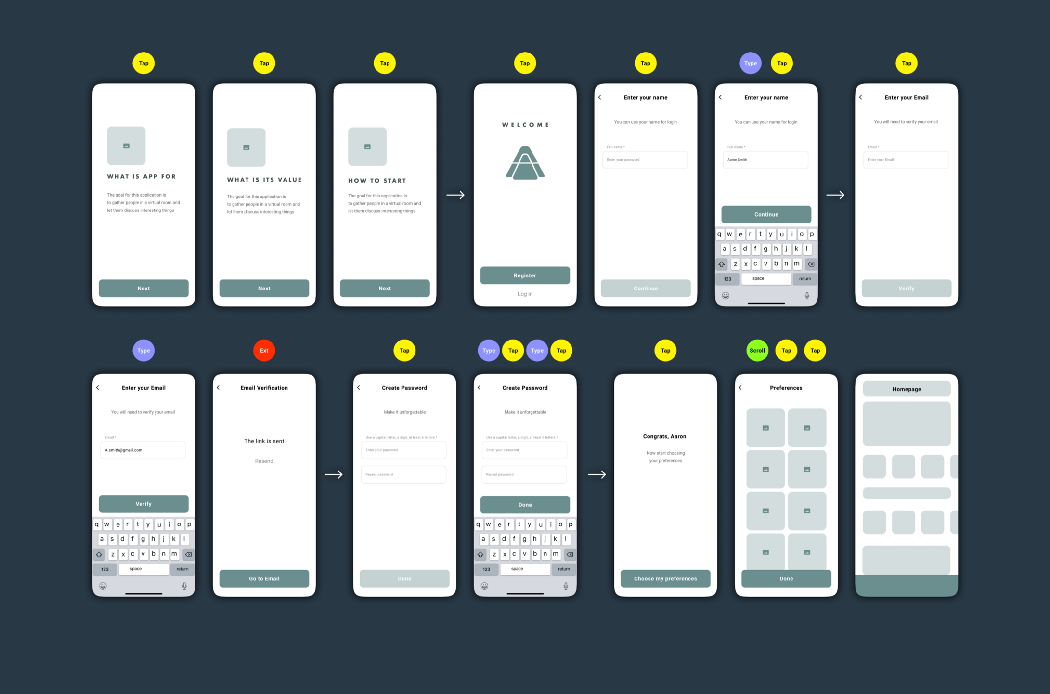
12 Taps / 4 Types / 1 External link / 1 Scroll
Simplify the flow
Now it is time to simplify the flow and count the actions again. I decided to turn the first four screens into one, placed all types of inputs together, and eliminated the number of password input fields. Here is the simplified version of the flow:
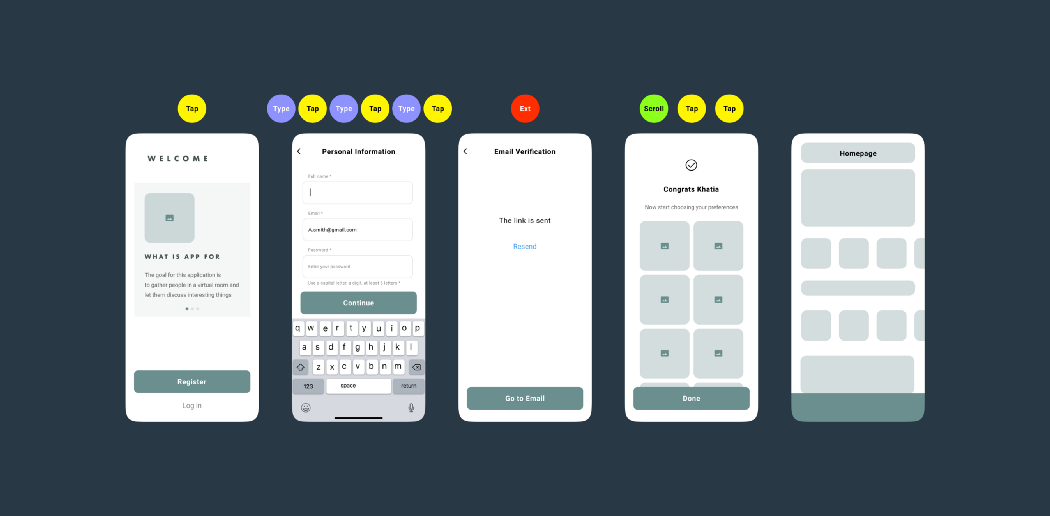
6 Taps / 3 Types / 1 External link / 1 Scroll
Calculate
As soon as we evaluate initial and updated flows, it is time to open excel and create two pages: one for the initial version and the other for the updated version. Enter simple formulas in the third column (e.x. =B1*3 — in case of taps — the number of taps multiplied by its value).
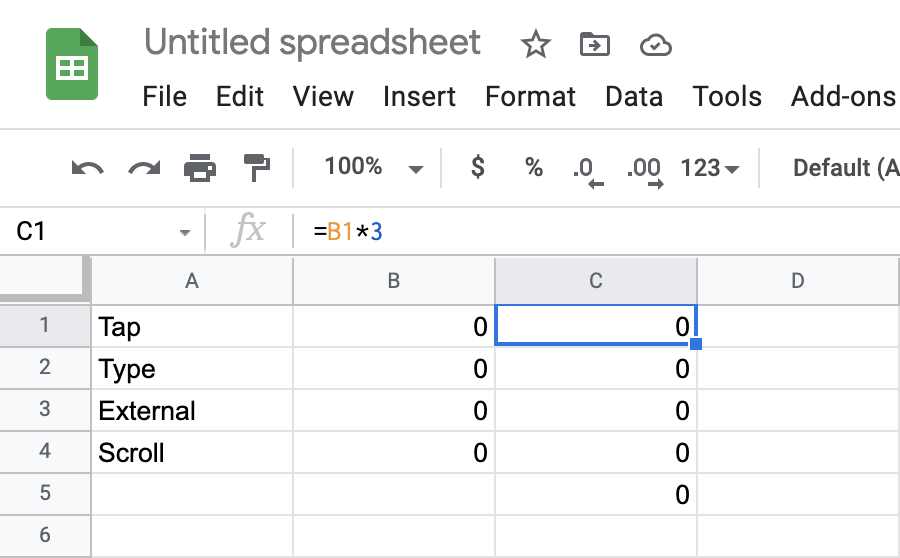
Tap counts =B1*3
As soon as there are formulas entered in the C column, fill in the B column with digits. The total score will appear in the 5th row & C column (enter =SUM(C1:C4 in it to view the result).
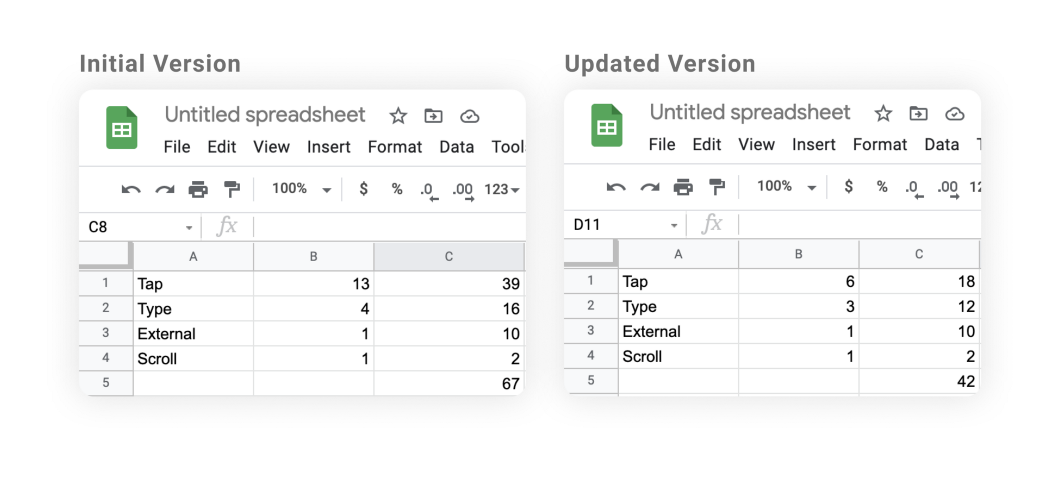
Working in Excel is optional, you can calculate everything using just pen and paper
Now you can see the results: the updated flow is 37% ((67–42)/67×100=37) simpler than the original one!
When is the method useful?
This method is useful while redesigning a website or an app, and while simplifying the most frequently used flows. Most importantly, as I mentioned above, all the data gathered can enforce your arguments during the negotiations with stakeholders.

